
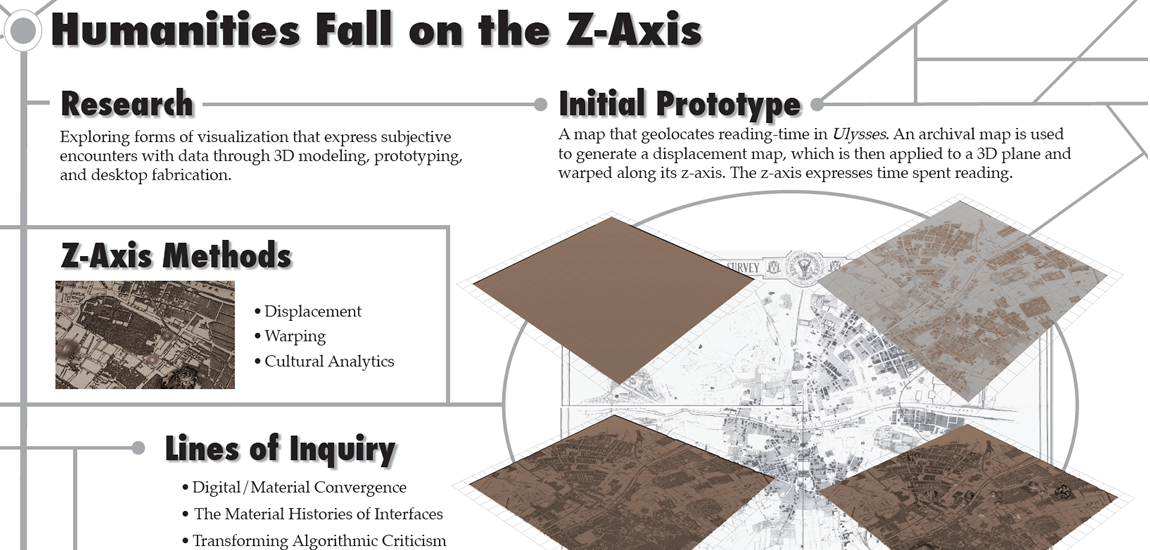
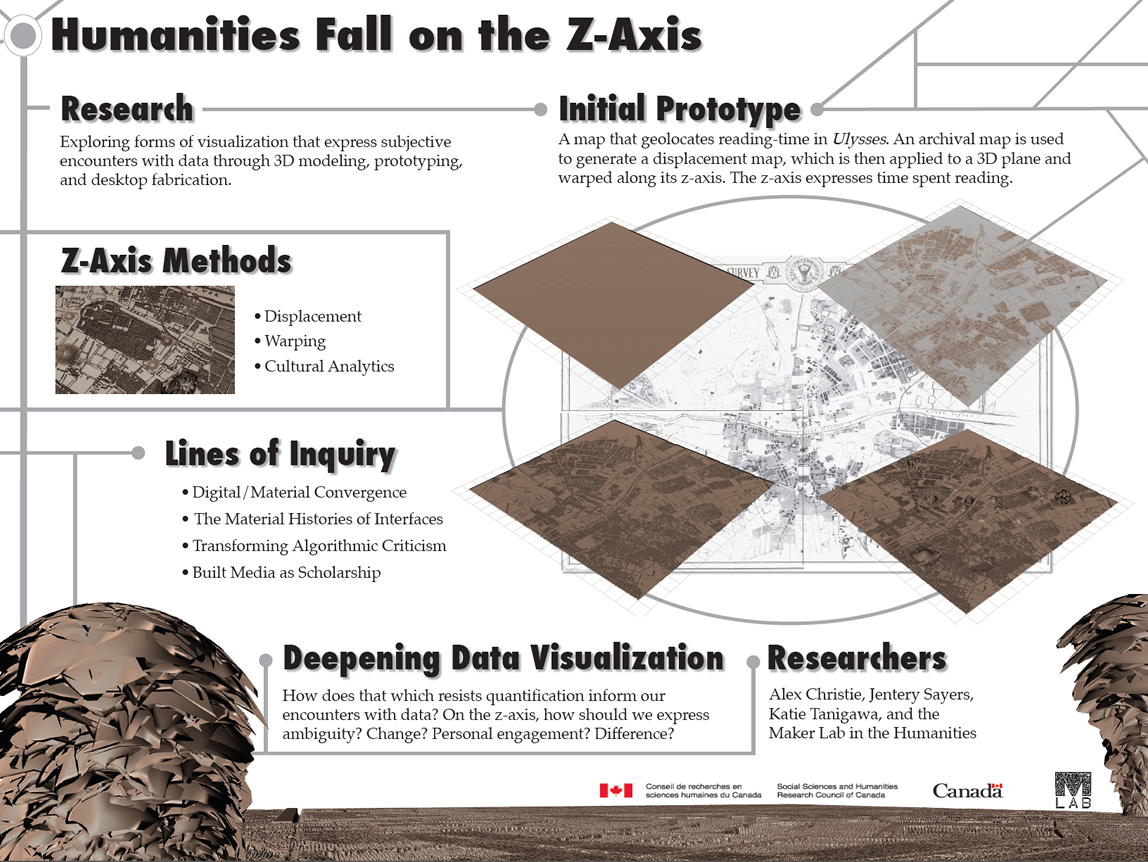
Last week, we released a poster for our “Kits for Cultural History” project (overview forthcoming), and today we are doing something similar, this time with our new “Z-Axis” research initiative, conducted in collaboration with the Modernist Versions Project (MVP). Like the Kits project, the Z-Axis initiative is in a nascent state. And it, too, will be one of the Maker Lab’s primary research areas during 2013-14. At CSDH/SCHN 2013, we presented a poster about it, and that poster is provided below as a low-resolution PNG. It is also available in PDF. Feel free to use either format for educational purposes. Soon we will publish an overview of the project here at maker.uvic.ca, but in this post I’ll touch briefly on its goals and motivations.
As the poster suggests, the Z-Axis initiative underscores the relevance of subjective encounters with data, with an emphasis on 3D modeling, prototyping, and desktop fabrication techniques. If, as humanities practitioners, we want to express our texts, media, and other cultural artifacts as data, then how are they felt? How are they experienced? What gives them texture? How are they welded or connected to embodied practices like reading and interpretation? Building upon research by Johanna Drucker, Kari Kraus, Mei-Po Kwan, Jerome McGann, Lev Manovich, Franco Moretti, Bethany Nowviskie, Stephen Ramsay, and Lisa Samuels (among others), the project explores speculative articulations of data with context, pushing methods like cultural analytics, programmatic ruination, and algorithmic criticism along the z-axis of data expression—through that third “variable” we in the humanities often use to stress the bodies, perspectives, and technologies that frame or situate otherwise abstract understandings of time and space.
To be sure, the Z-Axis initiative falls quite clearly on the “interpretive” end of the digital humanities spectrum. In other words, the maps, models, and 3D fabrications we are proposing will not—even superficially—present themselves as naturalized documentations or isomorphic replicas of actuality. They are not re-presentations or re-sources. Instead, they inject lived social reality into the workflows of data expression in order to assert the various ways in which the stuff of history is culturally embedded. For example, our initial prototype asks how readers might (consciously or unknowingly) experience Joyce’s Ulysses as a profoundly geospatial text. Which parts of Dublin does Joyce privilege over others? What are the geospatial biases of the novel? If readers interpret the novel as a map of Dublin, then what impressions does it leave? These questions are not particularly interested in the geospatial accuracy of Ulysses or its placed-based references. Instead, they are curious about how Ulysses transduces actual Dublin into fictitious Dublin, under what assumptions, and to what effects. You might say the Z-Axis project blends cartographic imaginations with cinematic impulses, or views from above with views on the ground. And this blend is anchored in the examination of how people (are at least intended to) interface with things like novels, maps, screens, and 3D prototypes.
Wondering how exactly the Ulysses prototype was made? Check out “Workflow for the 3D Map,” published by Maker Lab and MVP team member, Katie Tanigawa. As Katie acknowledges on her site and elsewhere, the workflow needs to be revised and improved through some additional research. However, at this juncture I will highlight how it brings print materials from the University of Victoria’s Special Collections into conversation with emerging digital methods, to then output an argument (i.e., a map) off the screen, in 3D. Not only does the workflow involve digitizing maps and encoding electronic versions of Ulysses with geospatial tags. It also systematically displaces and warps those maps using 3D sculpting software. Once they are watertight models, these maps can be printed using desktop fabrication software and hardware. Above, the poster only gives an elliptical sense of what a printed map would look like, by providing multiple bird’s eye views (in the “Z-Axis Methods” and “Initial Prototype” sections) and one worm’s eye view in the footer. Importantly, these images are born-digital; they are not photographs of an actual, printed prototype. Still, through the use of the z-axis (to express reading-time, for instance), the combination of these views would, in practice, foster attention to both pattern and texture. Yes, we still have some work to do. Nevertheless, we believe the prototype prompts a number of worthwhile research trajectories, especially where critical making meets modernist studies.
At this early stage in the project, we are wrangling with a number of important and difficult questions, including: How do the affordances of screen-based visualizations differ from printed models, and with what implications for literary and cultural criticism? Through what other forms or media (e.g., timelines) might z-axis methods be mobilized? Echoing Ramsay and Rockwell, how can these built media act as forms of scholarship? As standalones without essays that explain or rationalize them? How can z-axis methods be developed for comparative approaches to “versions” of modernism? To, say, the geospatial tendencies of modernist novels about either particular places (e.g., London, Paris, or New York) or travel/migration (e.g., Dos Passos’s U.S.A. trilogy)? When novels are still covered by copyright, how can data visualization and desktop fabrication spark “non-consumptive” interpretations (where maps, and not primary texts, are released online by research groups like the MVP)? How can fields like modernist studies actively generate new data about or from literary history (e.g., geodata related to reading-time)? And finally, how does data related to word count correspond with reading experience? When georeferencing a novel, what inferences (if any) can be drawn about the time spent attending to “difficult” text (and parts of a text)? What’s lost at scale, especially when we compare novels or chapters? In short, is word count a reliable indicator of time spent reading, or at least a persuasive way of getting at how novels are experienced over time?
During 2013-14, we’ll publish our responses here. For now, I want to thank everyone who has already contributed to the Z-Axis initiative: Alex Christie and Katie Tanigawa (two of our primary researchers), Stephen Ross (director of the MVP), Arthur Hain (for initially framing the research through the z-axis concept), and English 507 (who provided feedback during the Spring 2013 semester). Also, thanks to Nina Belojevic, Alex Christie, and Jon Johnson for working with me to make the “Humanities Fall on the Z-Axis” poster for CSDH/SCHN 2013.
Post by Jentery Sayers, attached to the ModVers and ZAxis projects, with the fabrication and versioning tags. Featured image for this post care of Nina Belojevic, Jon Johnson, and Jentery Sayers.
Pingback: Maker Lab in the Humanities » University of Victoria » Thinking through Infrastructure()
Pingback: Maker Lab in the Humanities » University of Victoria » Warping the City: Joyce in a Mudbox()