
What if publications offered readers a chance to play with the data (or capta) expressed in their visualizations, to challenge or confirm an article’s claim(s), to engage more directly in tacit learning and communal scholarship? What if an article laid bare not only its methods, but also its workflows, its data, and its code, and then let people play, tinker, or otherwise experiment with its data and graphical expressions? What if it even challenged people to “break” or modify its argument in order to further (or maybe redirect) its line of inquiry? What might this sort of publication look like? How would it work? And is this possibility slightly scary?
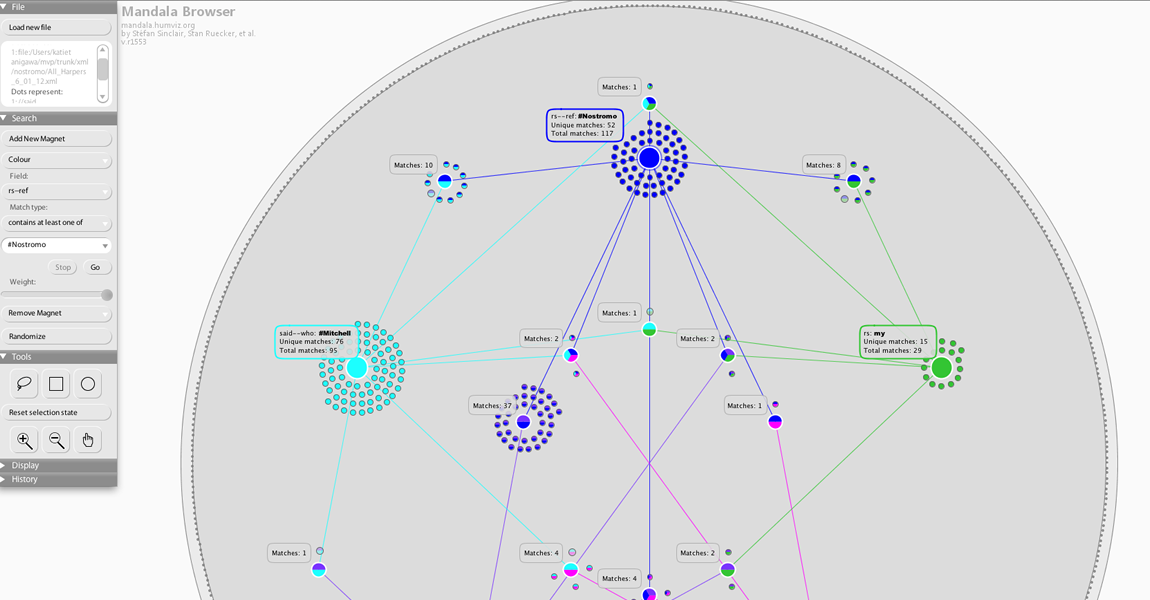
To begin addressing these questions, I’m imagining an article in an online publication like DHQ or NANO that would articulate a particular argument, and—instead of providing static images of data visualizations—it would embed a rich-prospect browsing interface (RPBI) like the Mandala browser into the argument itself. The data used in the article would be loaded into the browser, and audiences would be asked to play with that data, which the journal could also make publicly available (perhaps in various formats). For a first-year PhD student new to digital humanities, this possibility is both exciting and a bit terrifying. Among other things, this model is just begging for people to disprove, or at least rigorously test, your article’s claim and its corresponding data. Who wants a “break” button built into their scholarship?
In response to this question and its impulse, I think there’s another way to frame the integration of RPBIs into scholarly communication, and that is to think about the degree to which embedded browsers and other such tools for expression could help render our scholarship more persuasive and our data more transparent. This possibility would ask scholars to come together not just to break an argument, but to improve it. Such a model offers the research up to some playful and tacit hypothesis-testing that could afford new and unexpected insights in the humanities.
Of course, several questions emerge, including: How do you cite a source inside an RPBI? How reliable is the data in the first place? Where necessary, how could that data be made more reliable, or more persuasive? How much access do you give to audiences? And who is ultimately the author of an article that asks for audience engagement and creation? To be honest, I’m not entirely sure how to address these questions without actually enacting this mode of publication, so perhaps that is the next step. Write an article in which you share your data, outline the rationale for how the data was produced, and embed an RBPI so that users can play with your argument. More soon!
Post by Katie Tanigawa, attached to the ModVers project, with the versioning tag. Featured image for this post care of Katie Tanigawa’s use of the Mandala browser.